
Updated on
How Reporting and Analytics Differ on the Journey from Data to Business Value
It does not come as a surprise, that the terms reporting and analytics are used synonymously within the analytics ecosystem. They both ingest data, process the information, and present it through graphs or charts, or on dashboards. Even though reports and analytics both help organizations improve their productivity and enhance operational efficiency, they go about it in two different ways.
Reporting helps identify what is happening in a business, while analytics examines why it is happening and how it can be addressed.
Reports organize and summarize data making it easier to digest from a single source. Analytics, on the other hand, further questions the data for deeper insights. Insights that help understand and predict market trends, customer behavior, and competitor activity. Business Intelligence (BI) provided by analytics guide strategy creation for improving customer satisfaction, streamlining operations, and optimizing business growth and ROI.
Let’s take a closer look at reports and analytics, and how they offer business value.
Reporting: An Overview
To put it simply, reporting is all about collating all the existing data and presenting it in an easily digestible form. The data is gathered from multiple channels and the reporting process is specific and well defined. The objective is to capture, prepare, and accurately portray the data, as the data accuracy will determine if organizational goals are being met, and the business decisions to be taken.
Reports are available in various forms such as spreadsheets and tables, and more visual formats such as charts, graphs, and interactive infographics. And we can divide reporting into a two broad categories – managed and ad-hoc reporting.
Managed reporting: Managed reports are ones where technically proficient personnel such as an IT professional, prepare the data for use by non-technical end-users and decision-makers.
Ad-hoc reporting: BI tools with Ad-hoc reporting capabilities enable non-technical users to build new reports or edit existing ones, without support from IT, and with help from the tool’s embedded features such as Natural Language Processing (NLP). This allows end-users to not require coding expertise, and simply ask questions of the data.
Analytics: An Overview
Analytics is all about getting a deeper understanding of the data, and why the data appears the way it does. It also encompasses the creation of new data and insights, for adding value to the business. Analytics can be performed both manually and through automation, with the latter becoming prevalent over the past decade. Mostly because factors affecting a business are constantly in flux, and the answer to a business challenge may have a different solution presented through analytics on different days. Real-time analytics and quick access to insights have thus become indispensable to agile businesses.
The analytics maturity curve of an organization can be further broken down into five key phases, from descriptive to cognitive. Each has its merits, and businesses need to choose for themselves depending on their business requirements.
Descriptive Analytics leverages current as well as historical data to identify patterns, trends, and relationships. It answers the crucial question ‘what happened?’, and provides a streamlined view of enterprise data.
Diagnostic Analytics carry out investigative data mining and data discovery to identify ‘what happened and why it happened?’. This analytics process runs on the same technology, but drill-down further to the cause of the trends or anomalies being investigated.
Predictive Analytics leverages historical data in comparison to current data, in an attempt to determine future trends that can affect the business. It explores data with the objective of pinpointing ‘what is going to happen, why, and when?’, in order to pre-empt change and make informed decisions.
Prescriptive Analytics helps enterprises determine the best course of action based on the efficient analysis of data from across channels and touchpoints. ML and NLP capabilities work together to facilitate advanced querying capabilities, and help decision-makers determine ‘what is going to happen, and what should be done about it?’.
Cognitive Analytics is the future of the BI industry where man and machine work in perfect harmony. Advanced Artificial Intelligence (AI) capabilities, that will not only promote self-service analytics but enable machines develop self-learning abilities and to make human-like decisions.
4 Key Differences Between Reporting and Analytics
One of the simplest ways to view the difference between reporting and analytics is that reporting involves collecting data into a unified platform and using visualizations to aid in presenting the data. Analytics, on the other hand, interprets that data and provides it a context for better understanding by end-users.

The following are some of the differences between reporting and analytics –
Difference in Objective
Reports provide Information – Analytics drive Insights!
Reporting helps enterprises turn their data into information, but analytics transforms the information into insights. Analytics asks questions of the data that is available in the reports, with the goal of interpreting it. Upon completion of the analysis, the insights should be able to help an analyst prescribe strategies that will offer business value and drive business performance. Analytics is the answer to not only locating and understanding problems but finding the right solution to each problem.
The aim of reporting is to turn large unintelligible quantities of raw data, into a simple visualization for easier comprehension. And a robust reporting system goes on to enable smoother analysis, once all the data has been gathered from different sources and is presented on a single platform.
Analytics combs the data to identify the problems and offers solutions as well. With the goal of improving business functions and offering better experiences, data analytics has to always be capable of detecting problems, providing solutions, and concluding the process by analyzing the improvements. Analytics is key to understanding data, identifying business trends, driving data-backed decisions, for quick wins and long-term growth.
Difference in Process
While building a report one would usually start by identifying the business requirements, and collating all the relevant data. The data would then be translated to give it more context through simple visuals on a dashboard. The dashboard also promotes real-time reporting and supports capabilities for drilling deeper into the data.
Analytics is aided by all the data gathered in the reports, and it starts off by setting up an analytics roadmap and developing a data hypothesis. Based on the hypothesis, relevant data is ingested, analyzed through specific analytics models, and transformed into insights. The curated insights identify trends, business problems, and new business opportunities; while offering solutions to hurdles, and prescribing routes for optimal business impact. Analytics enable business decisions based on data and actionable business intelligence.
Difference in Visualization
Reports by default have to be defined before they are run, in terms of what parameters need to be included and factors to be considered. You have control when you set the parameters and run the report, but the report will include only what you have decided before the data collection process. You are limited by the columns that have been chosen for a particular report, because even adding one more column for another factor, would require you to run a different report. Only then can you attempt to decipher the data that is reported.
The following is an example of a standard report for a fiscal quarter, showing the comparison between the target and actual values for various revenue metrics.
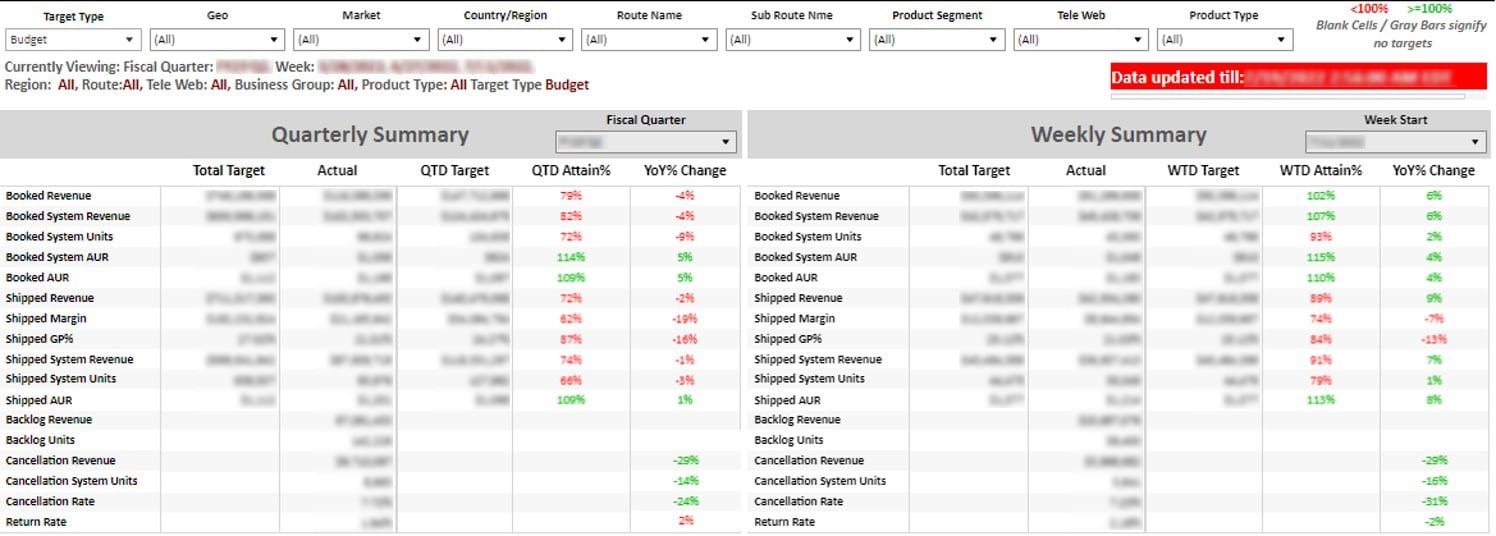
Analytics is a lot more dynamic and visualizes the analyzed data through simple images, that help identify trends and patterns.
Moreover, analytics fosters data exploration. Where the end-user can let their curiosity roam, and ask new questions of the data. They can simply change parameters and filters on a dashboard, or even use the tool’s Natural Language Querying capabilities, to find new insights, trends, and opportunities.
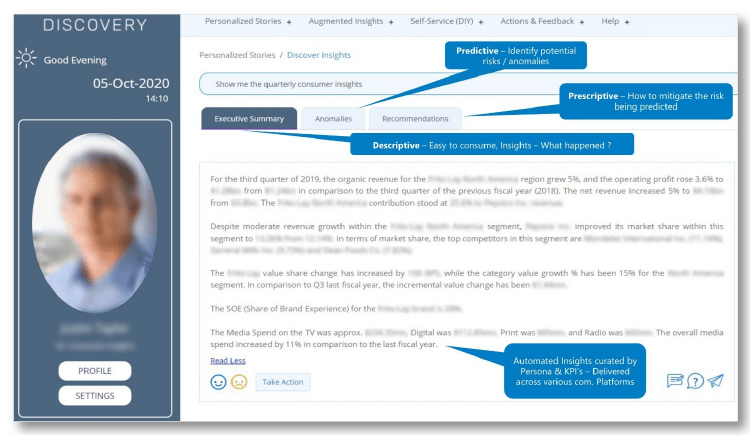
Cutting-edge business intelligence tools leveraging AI, ML, and NLG technology, enable users to customize the analysis by filtering the metrics; and what’s more, all the business intelligence is available in near real-time, without any manual effort required for breaking down the data.
The following is an analytics report generated for a specific user-persona, by our proprietary AI-driven analytics platform – Course5 Discovery
Difference in End-Users
The difference between reporting and analytics directly translates to a need for different personnel and tools for carrying out both tasks. Reporting analysts have access to data collection tools that they use to collect relevant data and turn it into information by making sense of the raw data.
Data analysts on the other hand do not need to do all the heavy lifting, since they have access to the reports and to more dynamic business intelligence tools. Automated data analysis helps them delve deep into the data with filters and dashboard customizations, giving context to the data. The context behind the data helps to understand data trends, identify opportunities, enabling stakeholders to take decisions on current and future business activities.
The following is a further break down the value-chain, and the different personnel involved in the entire process based on their individual technological capabilities –
- Ecosystem Assessment: Solution Architects, Tag Implementation Specialists, Analytics Consultants
- Implementation: Tag Implementation Specialists, Tag Auditors, Web Developers
- Data Collection: Data Engineers, Cloud/ Database Architects, Data Security Engineers
- Business intelligence: BI Engineers, Data Modellers, Visualization Consultants
- Analysis, Insights & Recommendations: Data Scientists, Business Consultants, Analytics Specialists
Reporting and Analytics for Different Business Problems
The processes for reporting and analytics for different business units are diverse and unique to each unit. The reporting metrics as well as the questions asked of the data for analytics insights adapt to each project and its specific requirements.
Here are some examples of reporting and analytics outcomes for different business areas:
| Customer Experience | Marketing | Supply Chain |
|---|---|---|
| Reporting Outcomes | ||
|
|
|
| Analytics Outcomes | ||
|
|
|
Conclusion
At the end of the day, you need a healthy amalgamation of both reporting and analytics capabilities to extract business value from enterprise data. Whether you have an in-house analytics team or are partnering with an analytics outsourcing vendor, the entire process starts with raw data and is an attempt to convert said data into actionable information. Reporting employs a number of tools to transform the data into solid information but is ultimately operating with the objective of simplifying the task for analytics tools.
Even if you have a concrete report on a business venture, it is only through analysis that you can truly understand what is going on within the business. This makes it a necessity for the reports to be impeccable so that the insights gained from analytics are accurate. Good reporting capabilities facilitate robust analytics and are the key to identifying and solving business problems with efficiency.
Don’t miss our next article!
Sign up to get the latest perspectives on analytics, insights, and AI.