Updated on
How is the Data & Analytics Ecosystem Changing?
The data and analytics ecosystem is going through a major transformation right now. The ongoing pandemic has accelerated the demand for AI-powered technologies and frameworks due to the kind of volatility, unpredictability, and disruption businesses are facing, both on the upstream and downstream ends of their supply and customer value chain. Organizations can enhance their analytics maturity by investing in the following areas: new-age technologies and frameworks that enable smarter exception handling, near-real-time operational insights, actionable prescriptive recommendations, and active closed-feedback loop systems.
At Course5, we partner with global technology, CPG, retail, and media brands to enhance their access to actionable insights and quality of decision-making through our analytics outsourcing services. In the last 18-24 months, we have noticed growing interest in building an analytics team, and increasing investment in areas like Graph Analytics, Natural Language Generation (NLG), Augmented Analytics, Search-driven Natural Insights, Embedded Analytics, and Prescriptive Analytics. The primary reasons behind these investments are low adoption of existing factual dashboards and scorecards, rising demand for causal and forward-looking insights, growing expectations around curated and personalized stories, and demand for near-real-time operational insights by Operations teams.
I was recently reading an interesting report – Gartner Top 10 Trends in Data and Analytics for 2020. They shared some exciting trends that can help data and analytics leaders across different industry verticals navigate their COVID-19 response and recovery and prepare for a post-pandemic reset. Rita Sallam, a distinguished analyst and VP at Gartner, said,
In the face of unprecedented market shifts, data and analytics leaders require an ever-increasing velocity and scale of analysis in terms of processing and access to accelerate innovation and forge new paths to a post-COVID-19 world.
Four of the ten trends highlighted in the Gartner report are closely aligned with what we do at Course5 Intelligence and here are my views on them.
Related: Data and analytics trends for this year
1. Smarter, faster, and more responsible AI
According to Gartner, by the end of 2024, 75% of enterprises will shift from piloting to operationalizing AI, driving a 5X increase in streaming data and analytics infrastructures.
We noticed an acceleration in demand for smarter and faster insights during this pandemic from our clients, primarily, the Supply Chain and Logistics functions at large CPG, FMCG, Retail, and Technology brands. The demand is for higher transparency and responsiveness across the value chain, with better sensing of demand signals due to the ineffectiveness of incumbent demand forecasting models and supply commitment challenges. Techniques like Exception Handling & Causal Analytics, What-if Scenario Planning, Predictive Analytics, and Search-driven Insights powered by NLP help our clients gain better visibility in their day-to-day operations and get near-real-time operational insights for faster decision-making.
The client’s internal IT and Advanced Analytics teams expect responsible AI deployment with better transparency around the underlying models and assumptions to protect themselves from making poor decisions. We are in an era where client organizations expect better collaboration from analytics consulting partners, fostering a conducive co-innovation environment to operationalize solutions better and build trust.
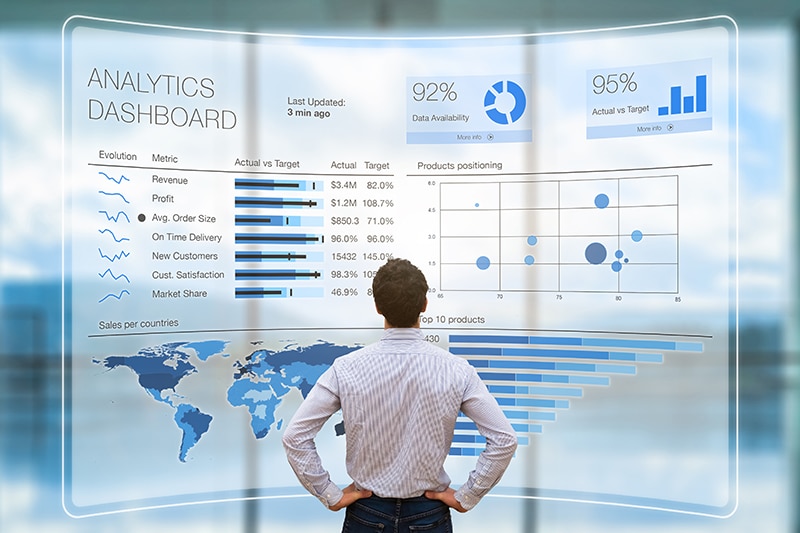
2. Decline of the dashboard
Over the years, dashboards get perceived as a solution to almost every business question. Undoubtedly, organizations are swamped by hundreds of dashboards built over the years to cater to various business users’ day-to-day operational needs. Ironically, a large percentage of these dashboards experience declining adoption after 90 days of their introduction into the analytics ecosystem. Here are the three most common reasons for this decline, based on our experience of working with some renowned brands in the industry:
- A significant percentage of dashboards are simply the assimilation of facts with no references to anomalies, exciting correlations, and forward-looking indicators. (Learn about the difference between reporting and analytics)
- Often, there is no story and context.
- Actionability and relevancy to the business user persona are often missing.
3. Data and analytics worlds collide
The collision of data and analytics will increase interaction and collaboration between historically separate data and analytics roles, driving innovation in analytics. This has an impact on not just the technologies and capabilities provided, but also the people and processes that support and use them. The spectrum of roles will extend from traditional data and analytics roles in IT to the information explorer, consumer, and citizen developer, for example.
To turn the collision into a constructive convergence, incorporate both data and analytics tools and capabilities into the analytics ecosystem. Beyond tools, focus on people and processes to foster communication and collaboration. Three areas where organizations need to invest are:
a. Set up a closed-feedback loop and productize your process and operations knowledge
In any organization, a large percentage of valuable knowledge sits in the middle management layer and unfortunately, a significant percentage of this knowledge resides in the conscious and subconscious mind of the workforce and rarely gets productized and leveraged to its maximum potential. This knowledge is also extremely vulnerable because it gets highly influenced by employee attrition. By decentralizing the Analytics and BI functions, and creating a Data Literacy Champion group, we can set up a closed-feedback loop among Business, IT, BI, and Advanced Analytics functions, which can be leveraged to create an organization-wide Knowledge Graph (Ontology Framework) that can sit on top of the enterprise data bus and enable the Advanced Analytics teams to bring additional context, relevancy, and actionability to their insights.
b. Augment your data stories for better adoption
Even now, a significant percentage of Data Stories communicated to business users and executives are factual and lack relevancy, context, and actionability. What business users are demanding is high Speed to Actionable Insights, Faster Action TAT, and Self-Service BI Adoption. These expectations can be met by investing in an AI-powered augmented analytics solution (e.g. Course5 Discovery) that enables proactive anomaly detection, causal insights, data simulations, and prescriptive recommendations. Since 2018, there has been a massive growth in investment in the Augmented Analytics category, and it’s going to get a decent percentage of the digital budget in the coming decade.
c. Develop a product mindset when it comes to data and its consumption
Business users and executives are living in a highly complex hyper-connected world where their needs are evolving rapidly. They have embraced the idea of context-switching, they expect speed, relevancy, and actionability in whatever they consume, and more than anything, they expect an analyst-on-demand. To meet the needs of this audience, corporates need to develop a Product Mindset when it comes to their data and start looking at data beyond dashboards and scorecards. This is a time to invest in building point solutions and apps that focus exclusively on unmet business needs, by making the consumption process easier (say, by publishing the insights via Chat, Voice, Search, Portals, Mobile Apps, WhatsApp, and Email) to enhance and expedite the decision-making process.
4. Relationships form the foundation of data and analytics value
We have entered an era where organizations need to start embracing the idea of productizing the qualitative knowledge that resides in different business functions and build an enterprise-wide Knowledge Graph (a smarter and logical representation of the different qualitative attributes based on advanced ontology). This is a much smarter way of structuring the knowledge than parking hundreds of documents into a Knowledge Management Portal with a belief that, a large percentage of the workforce will check out the document, get evangelized, and check in back with newer information. By structuring the knowledge into a graph, we can quickly transform it into a vector that can be leveraged as an input by a Machine-Learning model. This would be a more natural way of setting up a closed feedback loop between business and analytics.

Sushant Ajmani
Sushant is a seasoned digital analytics professional who has been working in the industry for over 23 years. He has worked with over 180+ global...Read More


Don’t miss our next article!
Sign up to get the latest perspectives on analytics, insights, and AI.